

Serviced Accommodation Returns in the East Midlands: 2026 Data Report
Executive summary: what the 2026 data actually shows
If you’re assessing serviced accommodation in the East Midlands in 2026, the pattern is clear:
Derby and Nottingham are occupancy-led markets. Returns depend on weekday fill, contractor demand and cost control.
Chesterfield sits between city and leisure dynamics, with smaller supply but stronger ADR potential.
The Peak District (High Peak proxy) is a rate-led market, with materially higher ADR and occupancy – but sharper seasonality risk.
Gross revenue numbers are seductive - but misleading. Net operating profit is driven by occupancy discipline and operational structure, not optimistic pricing assumptions.
This report benchmarks trailing 12-month performance (Feb 2025–Jan 2026), converts all figures into GBP, and models a realistic 2-bed example to show what actually reaches the bottom line.
If you’re a landlord evaluating management options, this dataset provides the baseline you should underwrite against - not the top 10% outliers.
Data sources, conversion methodology and definitions
This report triangulates the following sources:
2026 market pages from AirROI (Derby, Nottingham, Chesterfield and High Peak as a Peak District proxy; trailing 12-month data Feb 2025–Jan 2026; “last updated” 1 Feb 2026).
UK short-term rental dashboards released by VisitBritain/VisitEngland using Lighthouse (December 2025 report released Feb 2026; includes UK totals, regional splits and “on the books” forward indicators for Jan–Mar 2026). ⁶
Experimental government statistics from the Office for National Statistics (platform-derived counts; strong on seasonality and volume, not ADR). ⁷
Platform coverage context:
ONS measures short-term lets via major platform datasets (including Airbnb, Booking.com and Expedia Group). Lighthouse reporting also includes Vrbo. ⁷
Currency conversion
AirROI market pages are published in USD. All ADR and revenue figures in this report are converted into GBP using the Bank of England daily spot exchange rate for 23 Feb 2026. ²
Exchange rate used:
£1 = $1.3494
$1 = £0.7411
Conversion formula:
GBP = USD × 0.7411
For readability, most GBP figures are rounded to the nearest £1 while maintaining consistent underlying logic. ²
Market benchmarks for 2026 in GBP
The following benchmarks provide a practical underwriting baseline. They are not a business plan; they are market averages you either outperform through operational discipline - or you do not. ¹
ADR ranges and occupancy by market
Table: ADR and occupancy by market (GBP, converted from AirROI USD) ²
| Market | Active listings | Occupancy avg (annual) | ADR avg (£) | ADR range (bottom 25% → top 10%) (£/night) | ADR median (£/night) | Median annual revenue (£) | Peak revenue month | Low revenue month |
|---|---|---|---|---|---|---|---|---|
| Derby | 279 | 34.8% | 96 | 47 → 158+ | 88 | 8,697 | July | January |
| Nottingham | 878 | 34.9% | 108 | 56 → 176+ | 90 | 9,950 | July | January |
| Chesterfield | 76 | 37.2% | 125 | 64 → 199+ | 84 | 13,866 | August | February |
| Peak District proxy (High Peak) | 613 | 49.7% | 168 | 93 → 286+ | 121 | 26,272 | August | January |
How to interpret those GBP ranges (no nonsense):
Derby and Nottingham are lower-ADR markets in platform data. Strong serviced accommodation returns here rely on weekday fill, longer stays and direct or contractor demand - not weekend spikes. For a deeper breakdown of how this translates locally, see our Serviced Accommodation Management in Derby page and our Contractor Accommodation in Derby page.¹
Chesterfield is a smaller, more volatile comp set (fewer listings), so the “range” can swing harder by micro‑location and property type - but it shows a higher average ADR than the two core cities in this dataset. ⁴ See our page on Serviced Accommodation Management in Chesterfield
High Peak (Peak District proxy) has the highest ADR ceiling and stronger occupancy. That reflects the structural demand advantage of the Peak District leisure market - but winter softness remains real. If you’re evaluating this segment specifically, see our Peak District Holiday Let Management page for operational positioning. ⁵
What the wider UK and regional dashboard says (Dec 2025 → early 2026 view)
To sanity‑check local market data, you want a second lens. Lighthouse/VisitBritain provides that.
UK supply in Dec 2025: 441,193 STR properties available (+4% vs Dec 2024). ⁶
UK occupancy in Dec 2025: 40%, and “on the books” occupancy at end‑Dec was 28% for Jan 2026 and 23% for Feb 2026 (forward bookings snapshot, not final). ⁶
UK ADR in Dec 2025: £324, with forward ADR “on the books” shown as £279 (Jan 2026) and £301 (Feb 2026). ⁶
East Midlands regional context (Dec 2025): approx 21k STR properties in the region, supply up ~8% year‑on‑year, reserved nights ~238k (flat year‑on‑year), and occupancy shown at ~41% for the region in Dec 2025 (‑1pp YoY). ⁶
This matters because supply growth is the silent return killer: if supply rises and demand doesn’t keep up, either occupancy falls or ADR compresses. The December 2025 dashboard explicitly makes that point year‑on‑year. ⁶
Seasonality, demand drivers, and monthly planning curves
Seasonality is not “interesting”. It is your pricing calendar, staffing plan, maintenance windows, and cash‑flow risk.
Government data shows UK short‑term lets are strongly seasonal (August highest; January lowest), and that calendar effects like Easter materially shift month‑to‑month comparisons (March/April swaps). ⁷
Locally, the Peak District has the structural advantage: it is one of the most accessible and heavily visited national parks, with 13m+ visits each year and a huge catchment within an hour’s travel - which supports the weekend‑led leisure demand profile that typically pushes summer ADR. ⁸
AirROI seasonality buckets (converted) and what they imply
AirROI provides peak/shoulder/low season months with average monthly revenue, occupancy, and ADR. Below are the key converted seasonality benchmarks:
Derby peak season is listed as July/October/August with average monthly revenue ~£1,246, occupancy 40.5%, ADR ~£102. Low season is January/April/May with monthly revenue ~£904, occupancy 32.7%, ADR ~£96. ¹
Nottingham peak season is July/September/August with monthly revenue ~£1,488, occupancy 41.8%, ADR ~£110. Low season is January/February/April with monthly revenue ~£1,012, occupancy 33.9%, ADR ~£101. ³
Chesterfield peak season is August/July/October with monthly revenue ~£1,842, occupancy 44.5%, ADR ~£125. Low season is January/February/November with monthly revenue ~£1,336, occupancy 36.1%, ADR ~£122. ⁴
High Peak peak season is August/July/October with monthly revenue ~£3,109, occupancy 59.3%, ADR ~£169. Low season is January/February/November with monthly revenue ~£1,971, occupancy 42.8%, ADR ~£160. ⁵
The pattern is clear: the Peak District proxy shows materially stronger occupancy and ADR, but still experiences a winter dip. City markets show narrower seasonal lift - meaning you cannot rely on “peak season” to rescue the year. ⁵
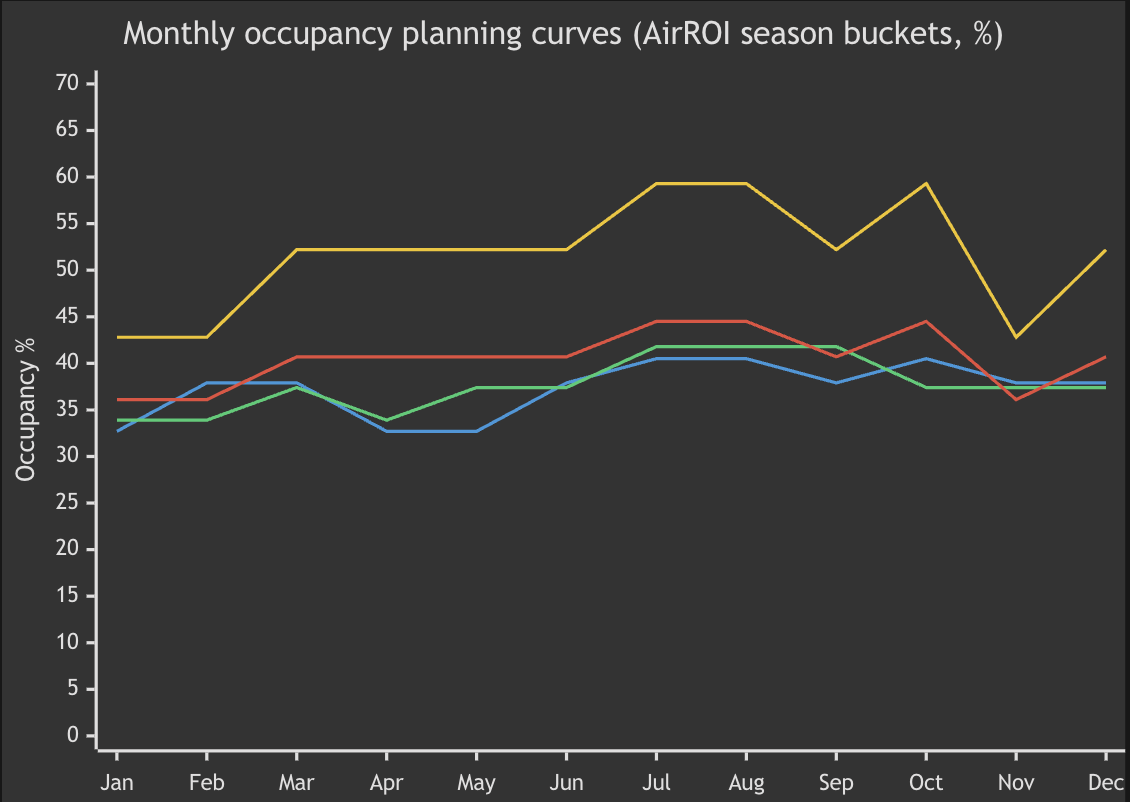
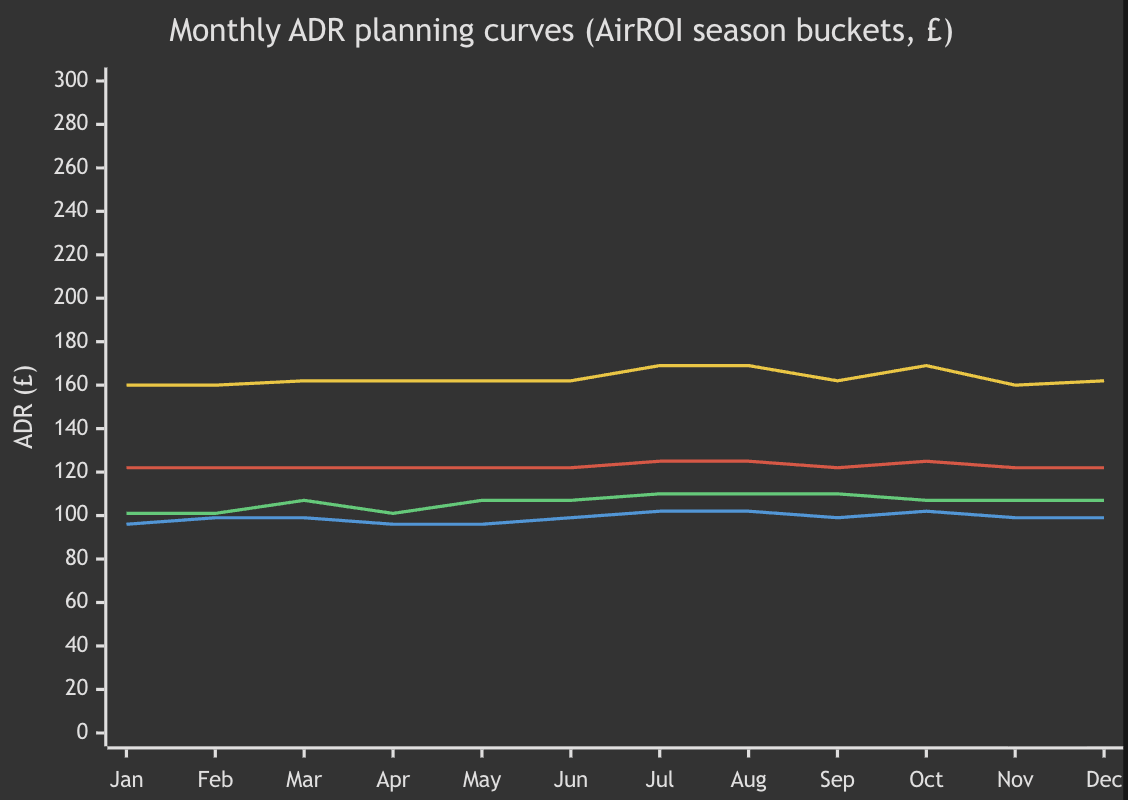
Monthly occupancy and ADR planning curves (market‑level)
AirROI does not publish a neat “12-month table” of actual monthly ADR/occupancy values in text, but it does publish peak/shoulder/low season months with average occupancy and ADR. The table below uses those season buckets to create a planning curve (assumption: each month takes the season average for its bucket). This is a practical budgeting tool, not a promise. ¹
Table: monthly occupancy and ADR planning curves (GBP) ²
| Month | Derby occ % | Derby ADR £ | Nottingham occ % | Nottingham ADR £ | Chesterfield occ % | Chesterfield ADR £ | High Peak occ % | High Peak ADR £ |
|---|---|---|---|---|---|---|---|---|
| Jan | 32.7 | 96 | 33.9 | 101 | 36.1 | 122 | 42.8 | 160 |
| Feb | 37.9 | 99 | 33.9 | 101 | 36.1 | 122 | 42.8 | 160 |
| Mar | 37.9 | 99 | 37.4 | 107 | 40.7 | 122 | 52.2 | 162 |
| Apr | 32.7 | 96 | 33.9 | 101 | 40.7 | 122 | 52.2 | 162 |
| May | 32.7 | 96 | 37.4 | 107 | 40.7 | 122 | 52.2 | 162 |
| Jun | 37.9 | 99 | 37.4 | 107 | 40.7 | 122 | 52.2 | 162 |
| Jul | 40.5 | 102 | 41.8 | 110 | 44.5 | 125 | 59.3 | 169 |
| Aug | 40.5 | 102 | 41.8 | 110 | 44.5 | 125 | 59.3 | 169 |
| Sep | 37.9 | 99 | 41.8 | 110 | 40.7 | 122 | 52.2 | 162 |
| Oct | 40.5 | 102 | 37.4 | 107 | 44.5 | 125 | 59.3 | 169 |
| Nov | 37.9 | 99 | 37.4 | 107 | 36.1 | 122 | 42.8 | 160 |
| Dec | 37.9 | 99 | 37.4 | 107 | 40.7 | 122 | 52.2 | 162 |
Illustrative charts for monthly planning curves
¹
¹
What actually drives seasonality in this region
These drivers are consistent across sources:
Summer dominance is structural: ONS shows August as the highest month nationally for guest nights, while January is the lowest - and year‑to‑year shifts can be driven by where Easter falls in the calendar. ⁷
Peak District demand is scale‑supported: the area benefits from very high visitation volume (13m+ annual visits) and easy access from nearby population centres, which amplifies weekend demand and school‑holiday spikes. ⁸
City seasonality is narrower: AirROI shows moderate seasonality with smaller spreads between low and peak for Derby/Nottingham, which is why city underwriting should focus on building consistent weekday demand rather than relying on “peak pricing”. ¹
Trip length is part of the cash‑flow story: Lighthouse reports average length of stay was 7.4 nights in Dec 2025 and notes the longest stays tend to be in January (then shorten into summer), which affects cleaning frequency, labour planning, and margin structure. ⁶
Worked example: gross vs net returns for a typical two‑bed serviced apartment
This section is the bit most investors skip - and it’s exactly why underwritten “returns” often disappoint.
Assumptions
A “typical” two‑bed serviced apartment (city model) is assumed:
ADR (blended): £125
Occupancy target: 70% (≈ 256 booked nights; ≈ 109 void nights)
Avg length of stay: 5 nights (drives turn/clean frequency)
Channel costs: 10% of revenue (OTAs + card/processing)
Management: 15% + VAT (modelled as 18% of revenue)
Cleaning & linen: £60 per turnover (clean + laundry/linen costs)
Utilities: £260/month
Council tax / rates placeholder: £1,800/year (treatment varies: council tax vs business rates depending on use and rating; not advice)
Maintenance & compliance: 4% of revenue
Consumables: £3 per booked night
Insurance: £450/year
Capital costs:
Replacement reserve: 5% of revenue
Setup/furnishing: £12,000 amortised over 4 years (£3,000/year)
This produces an operator-level net operating profit before financing and owner taxes. It is not a mortgage return model.
Gross-to-net waterfall
Worked P&L in GBP
Table: 2‑bed serviced apartment P&L (annual, GBP)
| Line item | Annual £ | Notes |
|---|---|---|
| Potential revenue at 100% occupancy | 45,625 | 365 × £125 |
| Less void nights (30%) | (13,625) | occupancy assumption |
| Gross room revenue | 32,000 | ~256 nights × £125 |
| Channel costs | (3,200) | 10% of revenue |
| Management fee (incl. VAT) | (5,760) | 18% of revenue |
| Cleaning & linen | (3,120) | ~52 turns × £60 |
| Utilities | (3,120) | £260/month |
| Council tax / rates (placeholder) | (1,800) | varies by setup |
| Maintenance & compliance | (1,280) | 4% of revenue |
| Insurance | (450) | placeholder |
| Consumables | (768) | £3 × 256 nights |
| Net operating income (before capital costs) | 12,502 | |
| Replacement reserve | (1,600) | 5% of revenue |
| Setup/furnishing amortisation | (3,000) | £12k over 4 years |
| Net operating profit (after capital costs) | 7,902 | before finance + owner taxes |
The ruthless point: gross revenue is not your return. If your deal only “works” at 85–90% occupancy, it doesn’t work - it’s a risk you’re pretending isn’t there.
Illustrative sensitivity: net profit vs occupancy
The sensitivity model makes one point brutally clear:
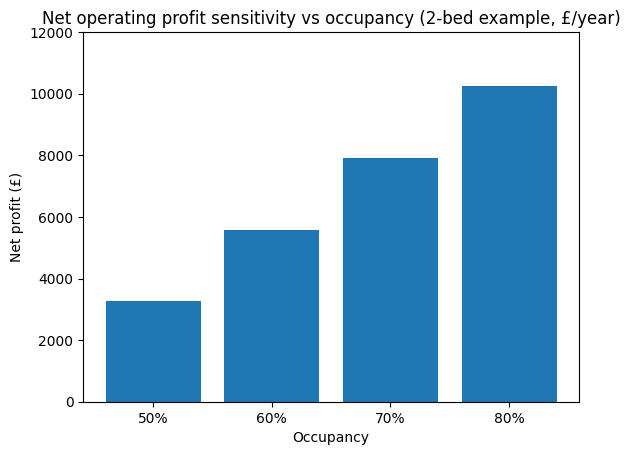
This is why professional operators obsess over weekday demand and direct corporate relationships. At lower occupancy, fixed costs crush you; at higher occupancy, margins expand rapidly.
What this means for landlords in 2026
Three conclusions stand out:
Median performance is the underwriting baseline. The top 10% ADR band is not automatic - it reflects proposition quality, reviews, operations and positioning.
Cities reward consistency. Corporate and contractor demand stabilises occupancy and smooths seasonality. Weak midweek demand destroys annual returns.
The Peak District rewards quality - and punishes weak execution. Higher ADR is achievable, but operational standards and review protection are non-negotiable.
If your deal only works at 85–90% occupancy, it does not work. The 2-bed model above shows how quickly margin compresses when occupancy drops.
Practical implications for investors and operators
If you want serviced accommodation to produce durable returns in 2026, focus on what actually moves the needle:
Underwrite using the median, not the top 10%. Premium pricing requires premium proposition and operational discipline.
Build weekday demand in city markets. Corporate relationships and contractor positioning matter more than weekend spikes. See our breakdown of Contractor Accommodation in Derby for how occupancy stabilisation works in practice.
Protect review scores in the Peak District. Leisure markets are unforgiving. Housekeeping consistency, maintenance scheduling and dynamic pricing discipline drive the difference between average and top-quartile performance.
Monitor supply growth. With approximately 21,000 STR properties in the East Midlands and year-on-year supply growth, differentiation must be structural - not cosmetic.
Be cautious with trend comparisons. Metric adjustments (including fee treatment and total rate presentation) mean year-to-year comparisons require care.
Assumptions and data gaps
This report is rigorous about what is known and what is estimated:
Peak District proxy choice: “Peak District” is not a single market boundary in most datasets. This report uses High Peak as a proxy because it is a substantial gateway area with robust listing volume in AirROI. This is a limitation, not a trick. ⁵
Monthly market averages: AirROI provides seasonality buckets and “peak month/low month” indicators, but does not publish a clean exported table of exact monthly ADR and occupancy values. The monthly tables and charts here are therefore season-bucket planning curves, clearly labelled as such. ¹
Government data completeness: The latest full ONS bulletin currently runs to June 2025 (released November 2025). Further 2026 releases are scheduled. Where 2026 sub-national volumes are unavailable, they are treated as unspecified rather than estimated. ⁷
Forward dashboard metrics: VisitBritain/Lighthouse January–February 2026 figures shown in the December 2025 report are “on the books” snapshots as of end-December 2025, not final completed months. Treat them as leading indicators only. ⁶
Tax treatment: Council tax versus business rates, relief eligibility, VAT treatment and owner tax position are situation-dependent. The worked example includes a conservative placeholder for local tax burden and excludes owner income or corporation tax.
Frequently asked questions about serviced accommodation returns in 2026
-
Yes - but only under disciplined underwriting. Median occupancy and realistic ADR assumptions must be used. Gross revenue figures alone are misleading; net operating profit depends on occupancy stability, cost control and operational standards.
-
In most East Midlands city markets, 65–75% occupancy with controlled operating costs is a reasonable professional target. If a deal only works at 85–90% occupancy, the risk profile is too high.
-
The Peak District (using High Peak as a proxy) shows higher ADR and occupancy in platform data. However, it carries stronger seasonality and operational risk. Higher potential returns require stronger execution.
-
When supply grows faster than demand, either occupancy falls or ADR compresses. The East Midlands has seen year-on-year supply growth, which increases the importance of differentiation and professional management.
Benchmark your property against this dataset
If you’re considering serviced accommodation in Derby, Nottingham or the Peak District, you should be modelling against conservative, median assumptions - not headline ADR.
If you would like a tailored income projection based on conservative underwriting assumptions, get in touch for a structured assessment of your property.